The old version is still available here
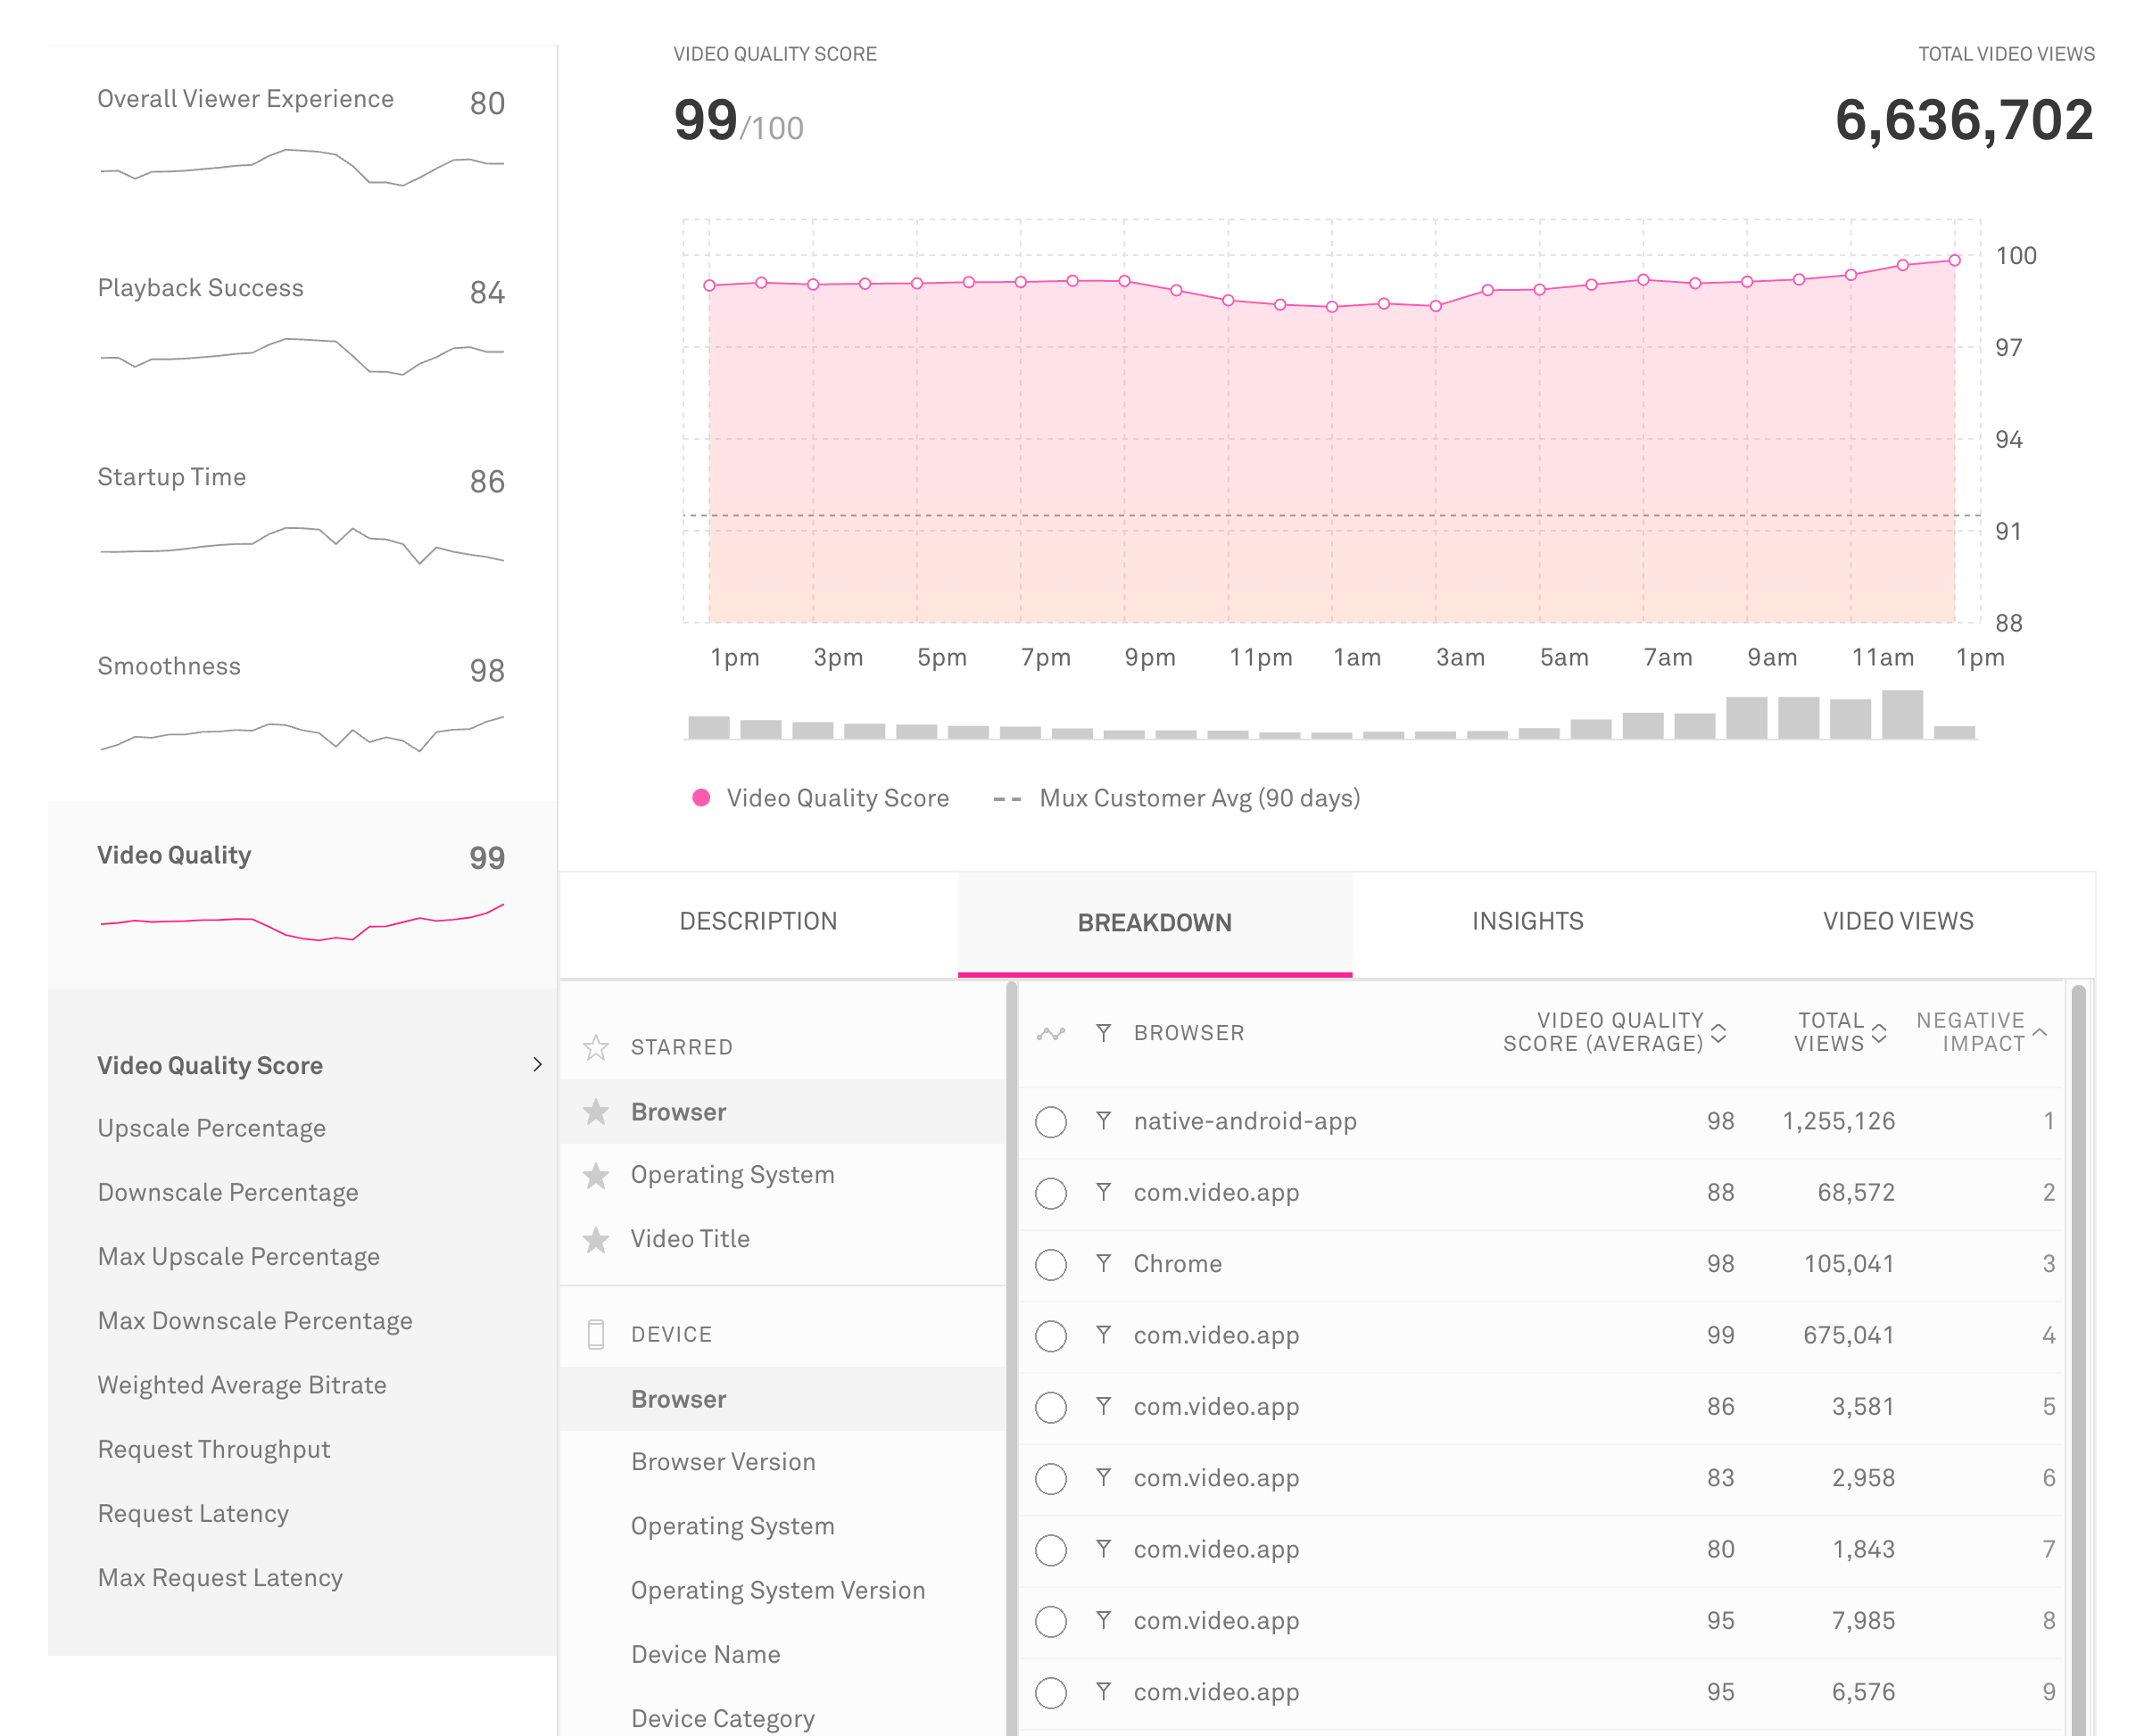
Video Quality
Video Quality compares the resolution of the video stream to the dimensions of the player.
Video Quality Score
Video Quality Score measures the visual quality a user sees by comparing the resolution of a video stream to the resolution of the player in which it is played. If a video stream is significantly upscaled, quality generally suffers, and viewers have an unacceptable experience.
Note that video quality is notoriously difficult to quantify, especially in a reference-free way (without comparing a video to a pristine master). Bitrate doesn't work, since the same bitrate may look excellent on one video and terrible on another.
Several factors contribute to actual video quality: bitrate, codec, content type, and the quality of the original source. However, if content is encoded well and at the right bitrates, upscaling correlates reasonably well to video quality. We use a combination of average and max upscaling in order to account for extreme drops in quality, even when it only occurs for brief moments.
Formula
where
Video Quality Score is inversely related to the upscaling percentage for each view. 85% of the score is based on average upscaling, and 15% is based on max (peak) upscaling.
Note that EBVS views do not receive a Video Quality Score.
Examples:
- No upscaling: 100
- 50% upscaling throughout: 85
- 200% upscaling for the first 30 seconds, and no upscaling for the next 20 minutes: 92
Use this metric to:
- Understand how video quality impacts the overall viewer experience
- Compare video quality to other areas of viewer experience
- Find areas where video quality can be optimized and improved
Upscale Percentage
Upscaling is when the video player has to increase the size of the video to fill the player’s display. For example, if the video source is 320x240 and the player size 640x480, the player will stretch the video to fill the player dimensions. In that process the quality of the video degrades.
Upscale Percentage is measured as the change in one dimension, specifically the dimension that fits the player first when upscaling. In the 320x240 to 640x480 example, the Upscale Percentage would be 100%, calculated as (640-320) / 320.
However while the video plays the upscaling percentage may change if a new video rendition is selected or if the player goes to fullscreen. For this reason in the total Upscale Percentage metric we multiply each upscale percentage by the amount of time the video was upscaled. If the video was upscaled 100% for half of the video, and 0% for half of the video, the Total Upscale Percentage would be 50%.
Use this metric to:
- Optimize the dimensions of videos to reduce poor quality due to stretching
Downscale Percentage
Downscaling is the inverse of upscaling, measuring when the video source is too big for the player and has to be reduced in size to fit the display. In the process of shrinking the video pixels are thrown out and essentially wasted. While this does not mean a reduction in video quality it does mean wasted bandwidth for you and the viewer, and significant occurrences of downscaling should be addressed.
Use this metric to:
- Optimize the dimensions of videos for bandwidth and cost savings
Max Upscale Percentage
While Upscale Percentage helps understand the volume of upscaling that’s occurring on your platform, the Max Upscale Percentage can help reveal points of significant upscaling, even if they don’t last the full video. It can also be more clear which video rendition may be the culprit as the percentage will exactly match the difference between a rendition and the player dimensions.
Use this metric to:
- Optimize the dimensions of videos to reduce poor quality due to stretching
Max Downscale Percentage
While Downscale Percentage helps understand the volume of downscaling that’s occurring on your platform, the Max Downscale Percentage can help reveal points of significant downscaling, even if they don’t last the full video. It can also be more clear which video rendition may be the culprit as the percentage will exactly match the difference between a rendition and the player dimensions.
Use this metric to:
- Optimize the dimensions of videos for bandwidth and cost savings
Weighted Average Bitrate
Weighted Average Bitrate is the time weighted average of the indicated bitrates that a viewer experiences during a video stream. The weighted average is calculated from the amount of time spent at each bitrate while a video is played. The bitrate value is the indicated bitrate from the video manifest for the rendition that is used for each segment of playback.
For example, if during a view lasting 3 minutes a video plays for 1 minute at 1Mbps and 2 minutes at 2Mpbs, the Weighted Average Bitrate would be: [(1Mbps * 1min) + (2Mbps * 2min)] / 3min = 1.67Mbps
This metric only includes the bitrates of video segments that are actually played. It does not include the segments that are downloaded but unplayed due to, for instance, an ABR algorithm that switches to a higher bitrate and discards previously downloaded lower bitrate segments in the cache.
Use this metric to:
- Measure and optimize the visual quality of the videos that viewers experience
Live Stream Latency (Beta)
Live Stream Latency measures the time it takes from when a camera captures an action in real life to when viewers of a live stream see it happen on their screen. This metric allows you to quantify the amount of latency viewers experience and to identify viewers that may be encountering high latency which would impact their viewing experience.
This value is sometimes referred to as the glass-to-glass latency for a live stream but it is usually more accurately called ingest-to-render latency. The clock time for the live stream is determined using the time specified in EXT-X-PROGRAM-DATE-TIME tags embedded in the HLS manifest. The time specified in the HLS manifest is compared to the current UTC time, as specified by Mux Data servers.
Standard HLS streams usually have a latency of about 30 seconds, and Low Latency HLS (LL-HLS) streams target 5-10 seconds.
Note that if you are attempting to compare latency across different infrastructures or video platforms it is important to understand when during the video capture, ingest, or encoding the EXT-X-PROGRAM-DATE-TIME tags are inserted. For example, Mux Video inserts PDT tags when the video is ingested for streaming. Because of this behavior you should expect the latency measured for Mux Video streams to be around 1 second lower than the actual glass-to-glass latency. Some other platforms behave similarly and would also omit the time before ingest time from latency. For each streaming platform you use, you should assess at what point during the streaming pipeline the PDT tags get inserted so you know what is being measured and can take that into consideration.
We make an effort to only calculate the latency when the player is playing near the live edge segment, as identified by the HOLD-BACK and PART-HOLD-BACK tags in the playlist, if specified. Viewers playing more than 5 minutes behind the live edge will be excluded from the metric.
For more information about EXT-X-PROGRAM-DATE-TIME tags please refer to the HLS specification.
Request Throughput
Request Throughput measures the average throughput, in Mbps, for all media requests that were completed. Throughput is measured as the number of bits received per second from the time a request is initiated until it is completed.
Note that request metrics are only available for certain SDKs and playbacks. See our docs for more information.
Formula
Each request has a total time loaded and a total bits downloaded. All of the bits loaded are added up and divided by the total request time (the sum of all time spent downloading those bits). If two requests are sent in parallel, they still have independent measurements which are added to the totals respectively.
sum(bits downloaded) / sum(request time)
For example, if there were three requests that each downloaded 40 Megabits (5MB) in one 4 second request and two 2 second requests then the request throughput is 15 Mbps, (40 + 40 + 40) / (4 + 2 + 2).
Use this metric to:
- Compare the performance of multiple CDNs
- Troubleshoot throughput problems by CDN, ASN (ISP), or geography
- Understand the bandwidth of your users across different geographies, devices, etc.
Request Latency
Request Latency measures the average time to first byte for media requests, that is the time from when the request is initiated to the time when the first byte of data is received from the server.
Note that request metrics are only available for certain SDKs and playbacks. See our docs for more information.
Formula
sum(time to first byte) / (number of requests)
For example, if the time for first byte for five requests was 100ms, 200ms, 100ms, 75ms, and 150ms, the Request Latency would be:
(100 + 200 + 100 + 75 + 150) / 5 = 125
Use this metric to:
- Compare the performance of multiple CDNs
- Troubleshoot latency problems by CDN, ASN (ISP), or geography
Max Request Latency
Max Request Latency measures the maximum time to first byte for a media request, that is the maximum time an individual request took from the time it was initiated to the time when the first byte of data was received from the server.
Note that request metrics are only available for certain SDKs and playbacks. See our docs for more information.
Formula
max(time to first byte)
For example, if the time for first byte for five requests was 100ms, 200ms, 100ms, 75ms, and 150ms, the Max Request Latency would be 200ms.
Use this metric to:
- Compare the performance of multiple CDNs
- Troubleshoot latency problems by CDN, ASN (ISP), or geography